Cape Coral New Construction Market Report: July 2026
572 new-construction homes on the board, median $444,950, 4.6 months of supply. What actually moved in July 2026 — and where the leverage is hiding.
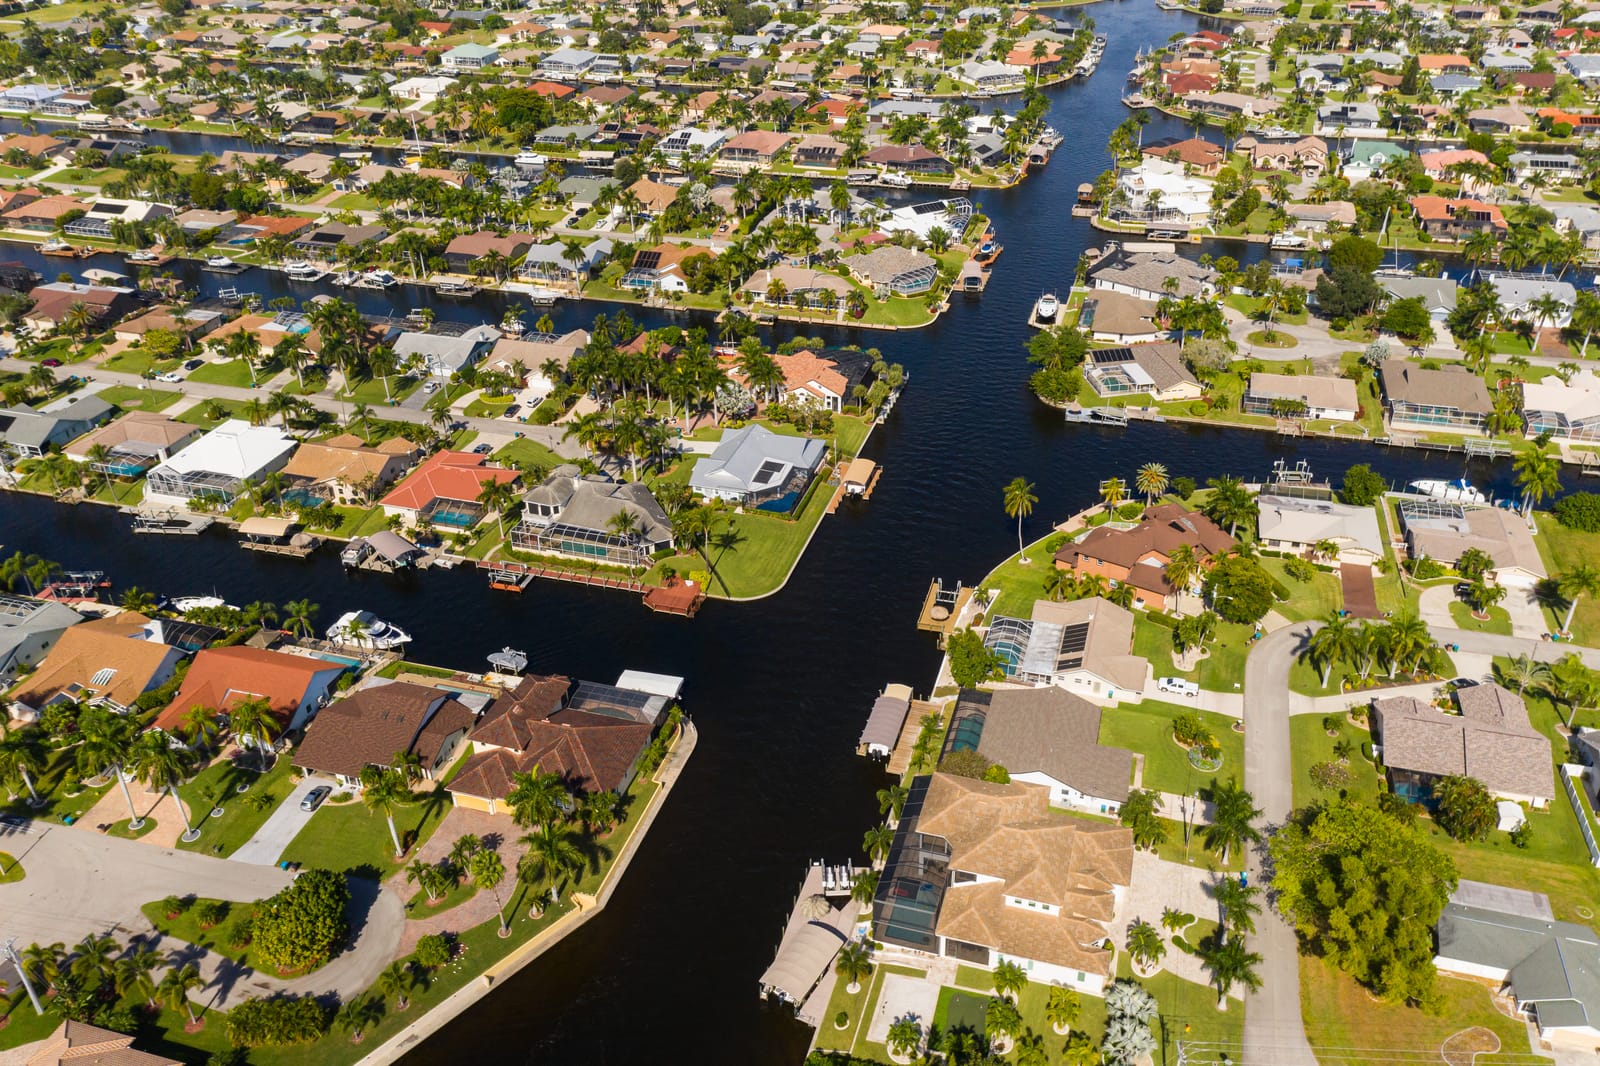
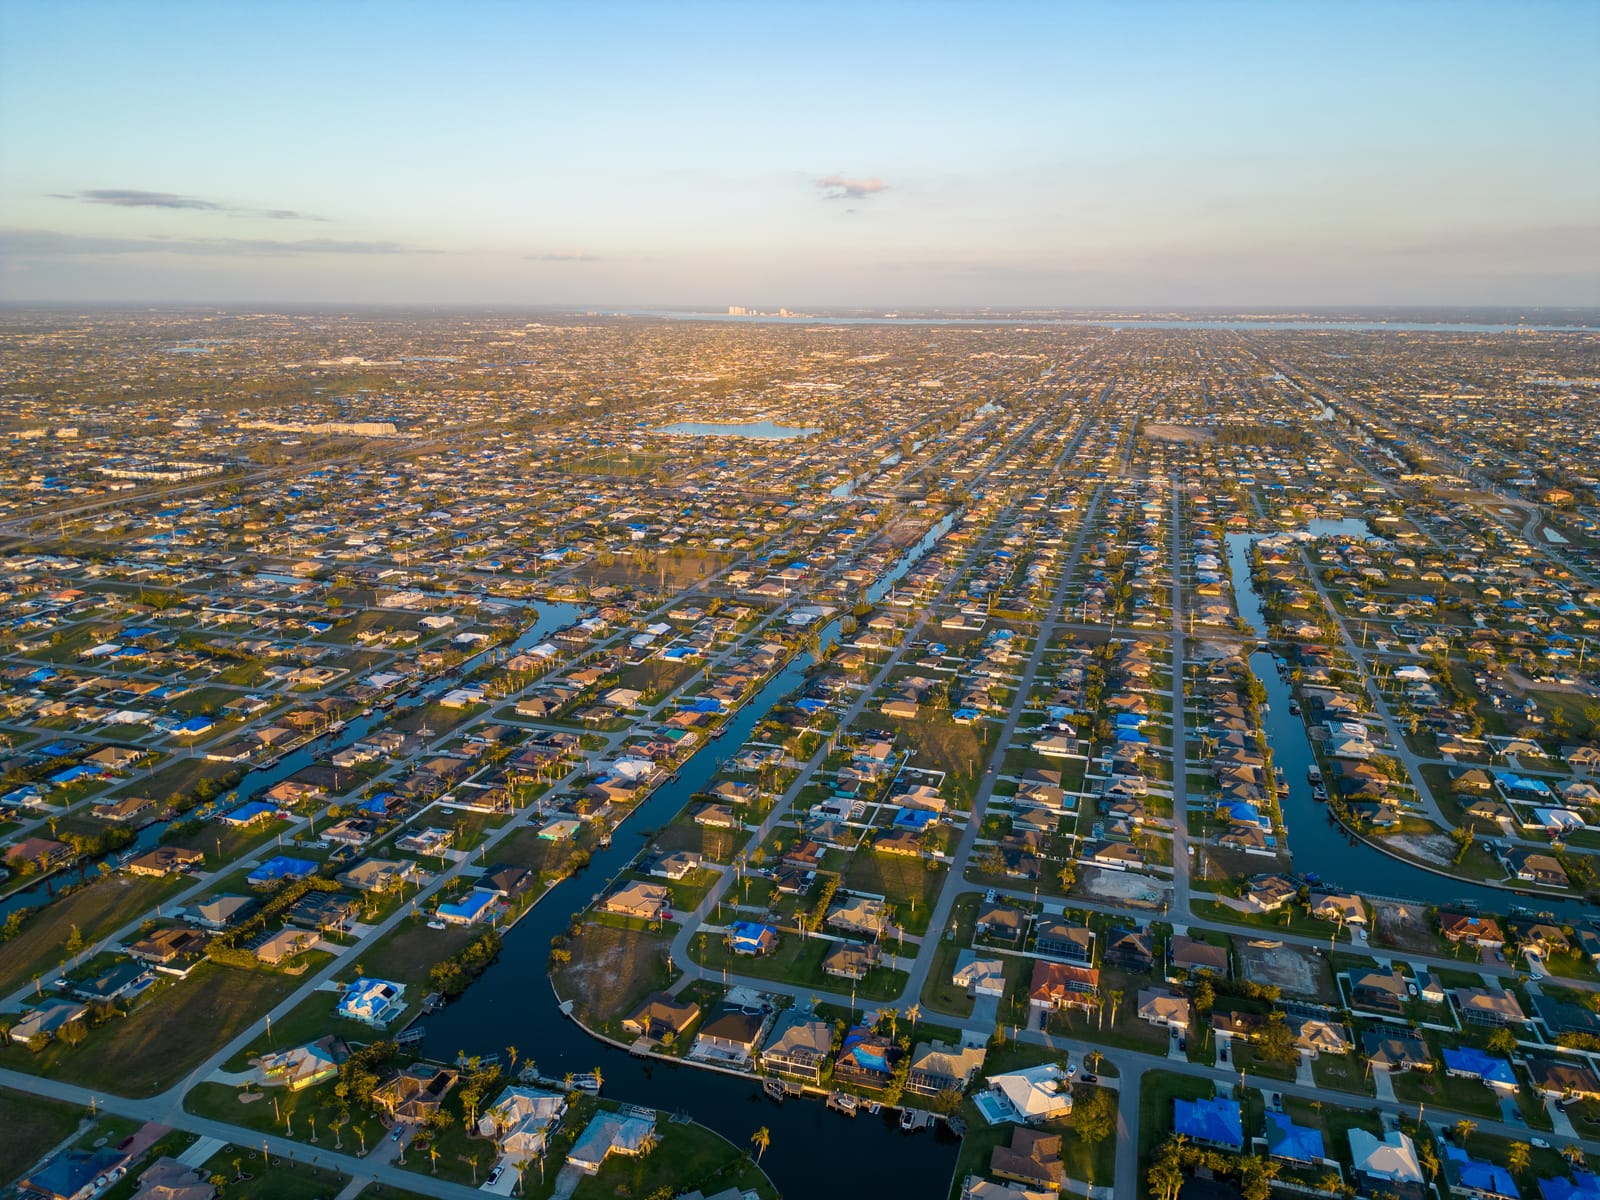
Pull up the live board today and you'll count 572 new-construction homes for sale in Cape Coral. Five hundred seventy-two. That's not a typo and it's not a screenshot somebody forgot to update from spring — that's the number as of this week, and it's the widest a Cape Coral buyer's selection has been in a long time.
So is that good news or bad news for you? Depends entirely on who you ask, and that's the whole point of a market report. A builder sitting on inventory calls 572 active listings a problem. A buyer shopping for the next month calls it an opportunity. I'm going to give you the real numbers and let you decide which side of that you're on — because both are true at once, and knowing which one applies to your search is worth more than any single headline stat.
The Cape Coral Numbers This Month
Here's the board as it actually reads today, straight off the live MLS feed:
| Metric | July 2026 |
|---|---|
| Active new-construction listings | 572 |
| Price range | $217,200 – $7,000,000 |
| Median list price | $444,950 |
| Avg. days on market (active) | 160 days |
| New listings, last 30 days | 103 |
| Closings, last 120 days | 502 |
| Median sale-to-list ratio | 99.0% |
| Median days on market (closed) | 101 days |
| Months of supply | 4.6 |
Start with the gap that matters most: 160 days average on the active board, but a median of 101 days on the homes that actually closed. Translation — the homes that sell, sell in about a third less time than the board average suggests. The average gets dragged up by the homes that are sitting, and sitting is a signal, not a fluke. We'll come back to that.
4.6 months of supply is the number an economist would circle. Six months is the textbook line between a buyer's market and a seller's market. Cape Coral, at 4.6, still leans toward the builder — but it's drifted meaningfully closer to buyer territory than it was a couple years back, and 103 fresh listings in the last 30 days tells you that drift isn't stopping.
Where the New Inventory Is Actually Landing
Not all 572 of those homes are spread evenly across the city. Three zip codes are doing most of the heavy lifting:
- 33993 (NW Cape Coral) — 252 active listings. Nearly half the entire city's new-construction inventory sits in this one zip.
- 33909 (North Cape Coral) — 153 active listings.
- 33991 (South Cape Coral) — 68 active listings.
Those top three zips alone account for 473 of the 572 homes on the board — 83% of everything for sale. If you're searching Cape Coral broadly and not finding much, you're probably not searching where the actual inventory is. Start in 33993 and 33909 and you'll see the bulk of what's really available.
On flood zones — a topic that gets its own full breakdown elsewhere on this site — of today's 572 active listings, 345 sit in minimal-risk Zone X and 227 sit in Zone AE. Zero are in coastal VE. That 60/40 split tracks with what we've said before: most of Cape Coral's new construction isn't the flood-insurance trap out-of-state buyers assume, and the inland, higher-ground zips carrying the bulk of this month's inventory lean X.
What the Wider Region Is Telling Us
Zoom out one level, because it puts the Cape's own numbers in context. The Cape Coral–Fort Myers metro area as a whole — every home type, new and resale combined — logged 10,575 active listings in June against 11,347 in May, with the metro median easing from $399,000 to $396,850 and days on market ticking up from 87 to 90.
Read that carefully: fewer listings, a slightly softer median, slightly slower sales. That's a metro cooling a notch, not collapsing. It's resale-and-everything-else data, not a new-construction-specific read — so don't hang your whole decision on it — but it tells you the direction the wind is blowing across Southwest Florida broadly, and new construction isn't swimming against that current.
Listen Up: What 160 Days on the Board Actually Means for You
Here's the skinny, and it's the one paragraph in this whole report worth remembering.
A home sitting 160 days isn't a warning label — in this market, it's often just the honest math of 572 homes competing for buyers. But it does mean one thing for certain: builders with inventory sitting past the 100-day mark are not in a position to say no to a real conversation. Don't walk into a model home assuming the sticker is the price. At 4.6 months of supply and climbing new-listing counts, you have more room to ask for a rate buydown, a closing-cost credit, or a price adjustment than you did two summers ago — and the builders who've had homes sitting the longest are the ones most likely to say yes. We break down exactly who's cutting prices and who isn't in this month's builder incentive report.
What you shouldn't do is assume every listing is desperate. Homes with 30-some days on market and steady closings are moving on their own merits, and those builders have less reason to deal. Know which kind of listing you're looking at before you make an offer.
💡 Key Takeaways
- 572 active new-construction listings in Cape Coral this month, median $444,950, up 103 new listings in the last 30 days.
- The active-board average of 160 days on market is dragged up by homes that are sitting — the homes that actually closed sold in a median of 101 days, a third faster.
- 4.6 months of supply keeps Cape Coral in builder-favored territory, but it's edged closer to buyer leverage than in recent years.
- Nearly half of all active inventory (252 of 572 homes) sits in a single zip code — 33993, NW Cape Coral.
- The broader Cape Coral–Fort Myers metro cooled slightly month over month (all home types) — context for the direction of the market, not a new-construction-specific number.
Frequently Asked Questions
How many new construction homes are for sale in Cape Coral right now?
As of July 2026, there are 572 active new-construction listings in Cape Coral, priced from $217,200 to $7,000,000, with a median list price of $444,950.
Is Cape Coral a buyer's market or a seller's market for new construction?
At 4.6 months of supply, Cape Coral still technically favors builders — six months is the standard tipping point toward a buyer's market — but rising new-listing counts and an active-board average of 160 days on market mean buyers have real negotiating room, especially on homes that have sat the longest.
What's the average time on market for new construction in Cape Coral?
The active board averages 160 days, but that number is pulled up by slower-moving listings. Homes that actually closed in the last 120 days had a median of just 101 days on market — a meaningfully faster real-world pace than the board average suggests.
Which zip codes have the most new construction in Cape Coral?
33993 (NW Cape Coral) leads by a wide margin with 252 active listings, followed by 33909 (North Cape Coral) with 153 and 33991 (South Cape Coral) with 68. Those three zips hold 83% of the city's entire new-construction inventory.
Are homes selling at asking price in Cape Coral?
Closed sales in the last 120 days landed at a median 99.0% of list price — sellers aren't giving homes away, but there's a small, real gap between ask and close that a good offer can work with.
See What's Actually Available
The board changes every week. See it live, filtered by what matters to you:
- Every active new build in Cape Coral
- NW Cape Coral (33993) — the largest concentration of new construction in the city
- New construction under $400K
- Live market data dashboard
Not sure whether this month's number of new listings means you should move now or wait? That's the whole reason we're here.
If you need a straight read on the Cape Coral market before you make an offer, call us at (239) 422-7459 and we'll tell you which listings actually have room to negotiate — and which ones don't.